Integrating Tracy Profiler in C++
Integrating Tracy Profiler can give a lot of insight for a little bit of effort. Here's how to drop it into your source tree and use it.
While watching Nothke stream some development on a game and a custom engine, I mentioned the Tracy Profiler, which I use with luxe and it's very useful. One of the frictions with using it is that the source tree of tracy is very busy and has a lot of stuff going on, it can be hard to judge how simple integration should be.
So here's how to drop Tracy into your c++ project sources and start using it, by copying the Tracy code directly into the source tree. This is from version 0.8.1 era of Tracy.
Let's say your code was stored in src/, this would be src/tracy/ in the below example.
Step 1 - The source files needed
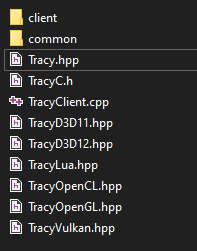
Two key folders: common/, client/ and TracyClient.cpp and friends from the root. I'm using OpenGL profiling too but you can remove the other files as needed. I kept them cos it's easier than micromanaging when I add backends. I don't use lua so I removed that.
I copy these into my project source code folder under src/tracy/ so e.g src/tracy/common.
Step 2 - Building
You only need to include TracyClient.cpp into the build. Add this to your project, makefile or build script as needed.
You need two things:
- add a define to your code -
TRACY_ENABLE - add an extra include path to your build -
src/tracy/
Then it can find it's include files, and so tells the profiler to exist. If you remove TRACY_ENABLE that build has no profiling code and no overhead from the profiler.
includedirs { "src/tracy/" } and defines { "TRACY_ENABLE" } that you'd add or edit.In Visual Studio, for the include path it's
Properties -> C/C++ -> General -> Additional Include Directories
and for the define
Properties -> C/C++ -> Preprocessor -> Preprocessor Definitions
For clang or GCC on the command line, it looks like this:
-DTRACY_ENABLE -Itracy/. error C2011: 'sockaddr': 'struct' type redefinition, try adding a define WIN32_LEAN_AND_MEAN to your project defines. This has to do with windows.h and winsock 2 vs winsock original APIs, and is quite a mess.You can also try define this before including tracy headers.
#define WIN32_LEAN_AND_MEAN #include "Tracy.hpp"Step 3 - Including and using
Start by including Tracy. There's a C header if you want.
#include "Tracy.hpp"
Frame marker
Next we'll be telling Tracy where your frame marker is. Inside the tick or update function in your engine, add FrameMark("main");. This gives Tracy enough to start with. If you build + compile you should be able to already connect the Tracy application and see the frame timing.
Open the Tracy profiler application
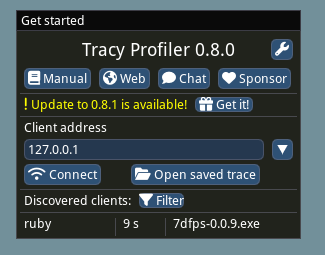
Now that we've included the code inside our project, that's step one. That means our game (the client) is able to send information out. It needs somewhere to send it to - which is either a command line tool tracy calls capture, or a profiler applicaton with the UI. The UI is the one we want for now.
You can usually grab a matching version from the releases download section for Tracy here. The 7z file is a zip file containing files like Tracy.exe, which is the application.
Running this application, and then your game, you should see the "discovered clients" list populate with your application. I ran this on a game called 7dfps-0.0.9.exe, so clicking the 7dfps-0.0.9.exe application from the list will launch a profiling session.
Note that tracy works over networking too, so you can run the linux build of your game on a different computer and profile from Windows (or on mobile, or console devices etc).
Scoped Measurements
Next up, we probably want to profile some scope specifically. Say the render function. At the top, add ZoneScopedN("render"); which will add a named zone to the profile, automatically for that scope. There's also ZoneScoped;.
That's it! You should now see a single zone somewhere within your frame.
Step 4 - clean integration
Since I have multiple profilers I use or try, including custom ones, I like to make the profiling tags shared using macros. So for Tracy I have something like this.
#include "Tracy.hpp"
#define LUXE_PROFILE ZoneScoped
#define LUXE_PROFILE_FRAME(x) FrameMark
#define LUXE_PROFILE_SECTION(x) ZoneScopedN(x)
#define LUXE_PROFILE_TAG(y, x) ZoneText(x, strlen(x))
#define LUXE_PROFILE_LOG(text, size) TracyMessage(text, size)
#define LUXE_PROFILE_VALUE(text, value) TracyPlot(text, value)- Tags give regions more detail, e.g there's 5 render functions, you can send a tag like "background", "foreground" etc.
- The log one is sent from the logging function, any and all logs in game or engine will be sent to tracy so you can view logs alongside profiling timing.
- The value one plots numbers, e.g memory allocations from Wren
Step 5 - Memory Profiler
There's also a really cool memory profiler, so you should look into that. All memory in luxe goes via custom allocators, so it's easy to add profiling. For some reason I used the C API. The 12 is stack depth.
#include "TracyC.h"
#define LUXE_PROFILE_ALLOC(p, size) TracyCAllocS(p, size, 12)
#define LUXE_PROFILE_FREE(p) TracyCFreeS(p, 12)
With that, I can see all memory allocations, frees, callstacks etc.
Step 6 - OpenGL Profiling
Start by telling Tracy about your context using TracyGpuContext. This is called after your OpenGL context is initialized, and before any GPU zone is profiled.
SDL_GL_CreateContext(window);
TracyGpuContext;Then define a gpu region macro.
  #include "TracyOpenGL.hpp"
  #define LUXE_PROFILE_GPU(x) TracyGpuZone(x)
Then I can use it inside scopes, like LUXE_PROFILE_GPU("use program"); or LUXE_PROFILE_GPU("draw indexed");
These are added at the top of a scope, and any opengl calls with be measured within it, even though they're async.
After Swap Buffers, add TracyGpuCollect; which sends the info to tracy.
SDL_GL_SwapWindow(window);
TracyGpuCollect;End Results
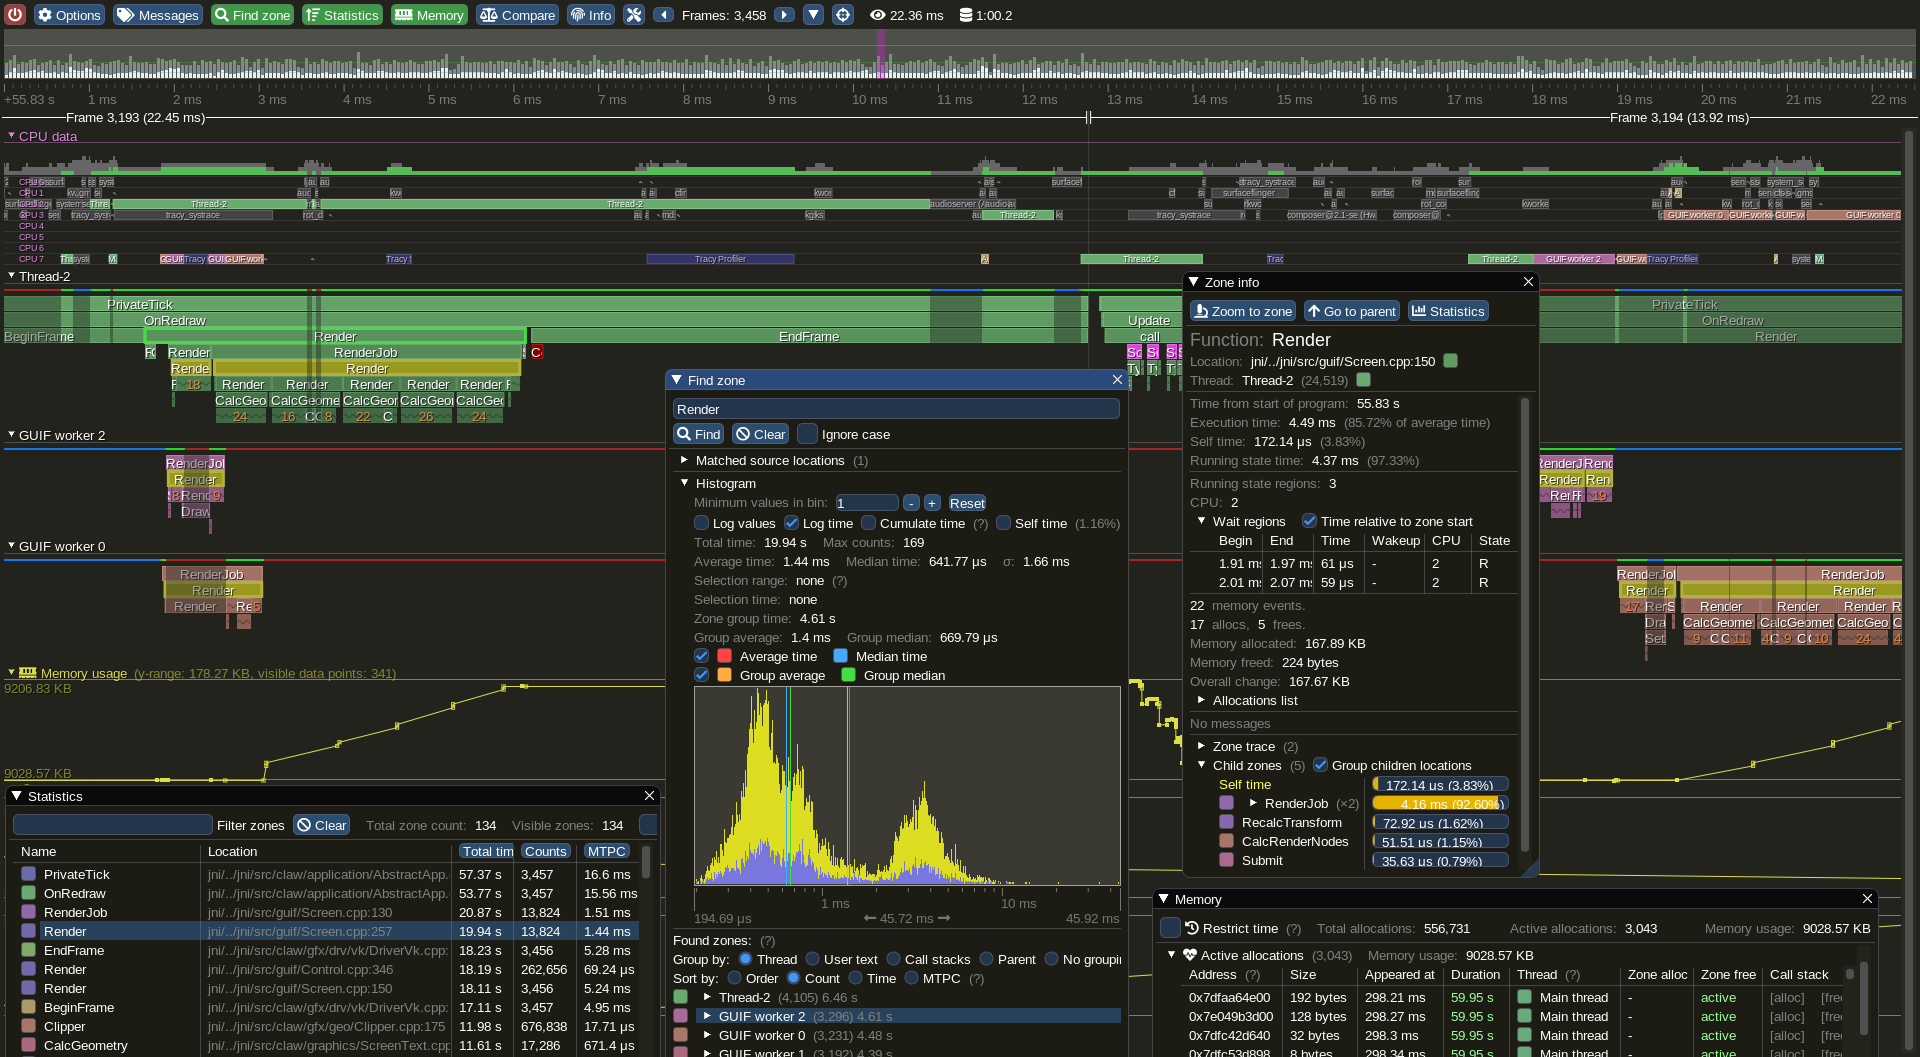
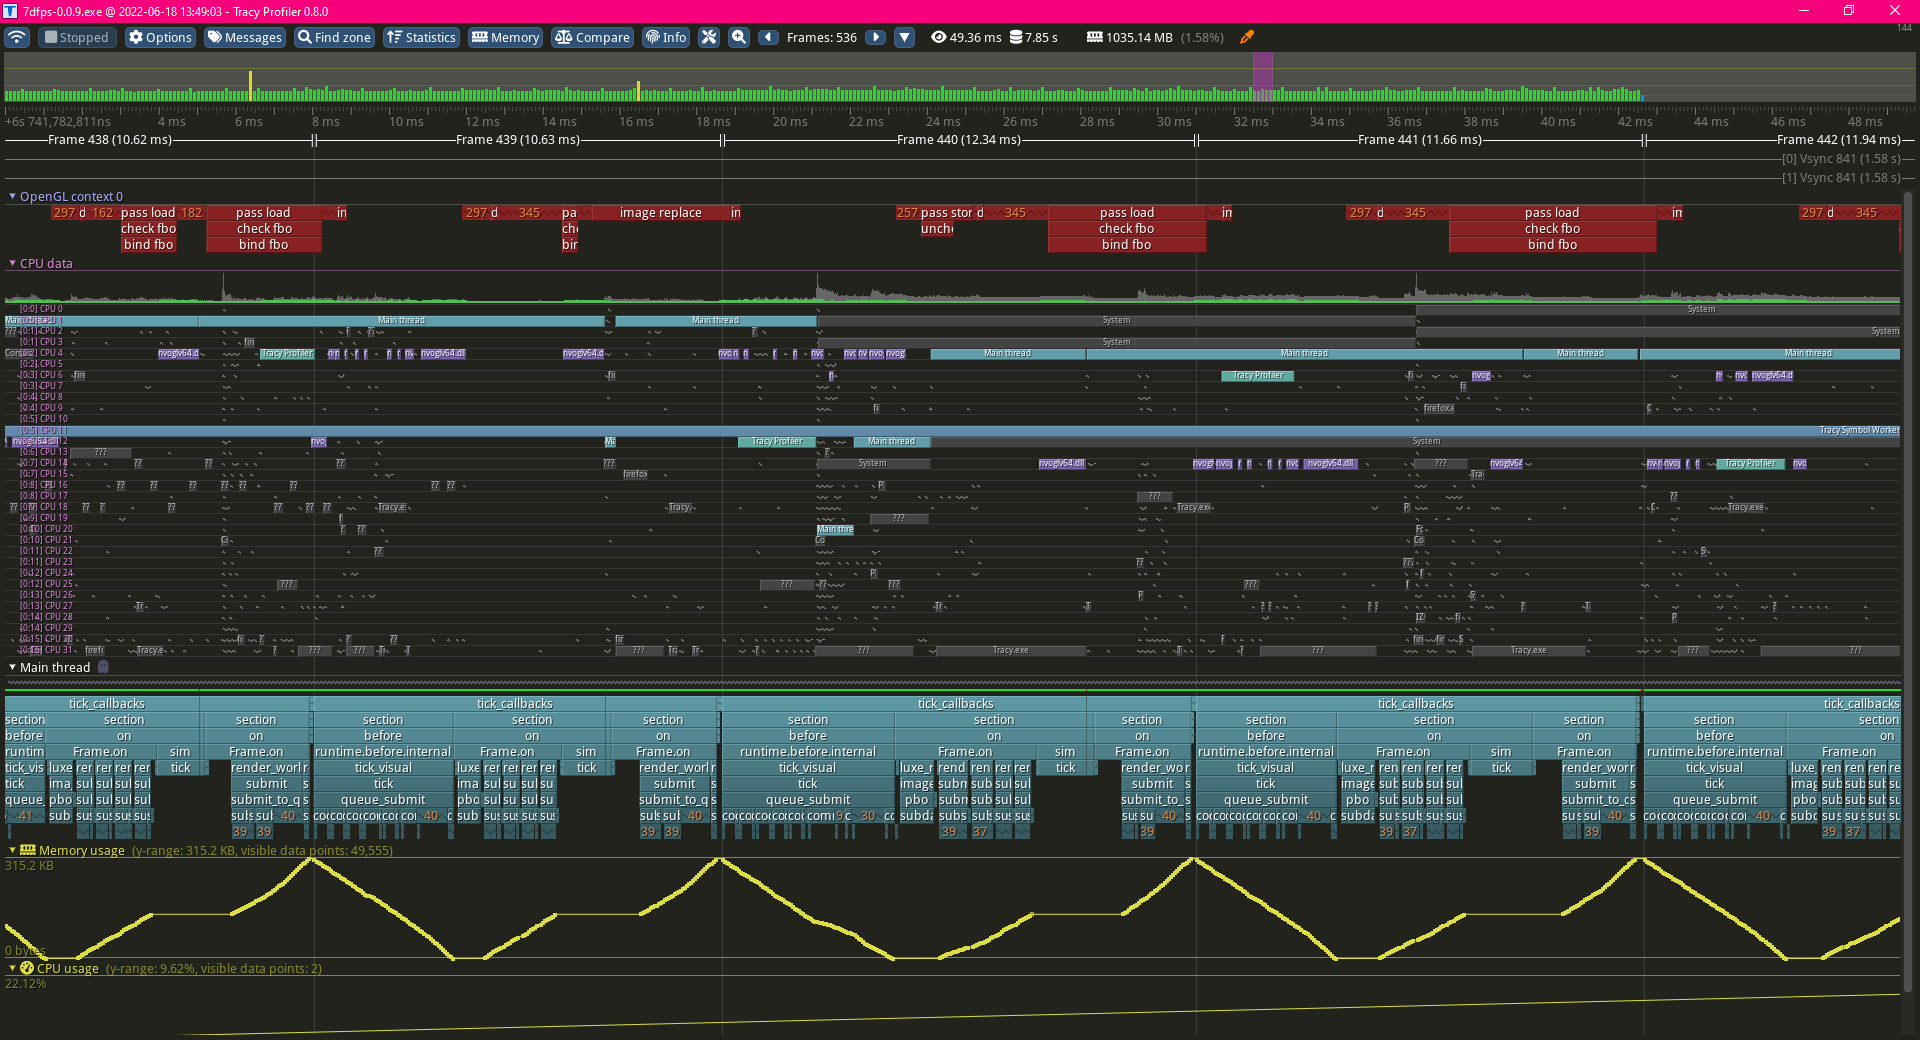
With so little effort, you already get a ton of info.
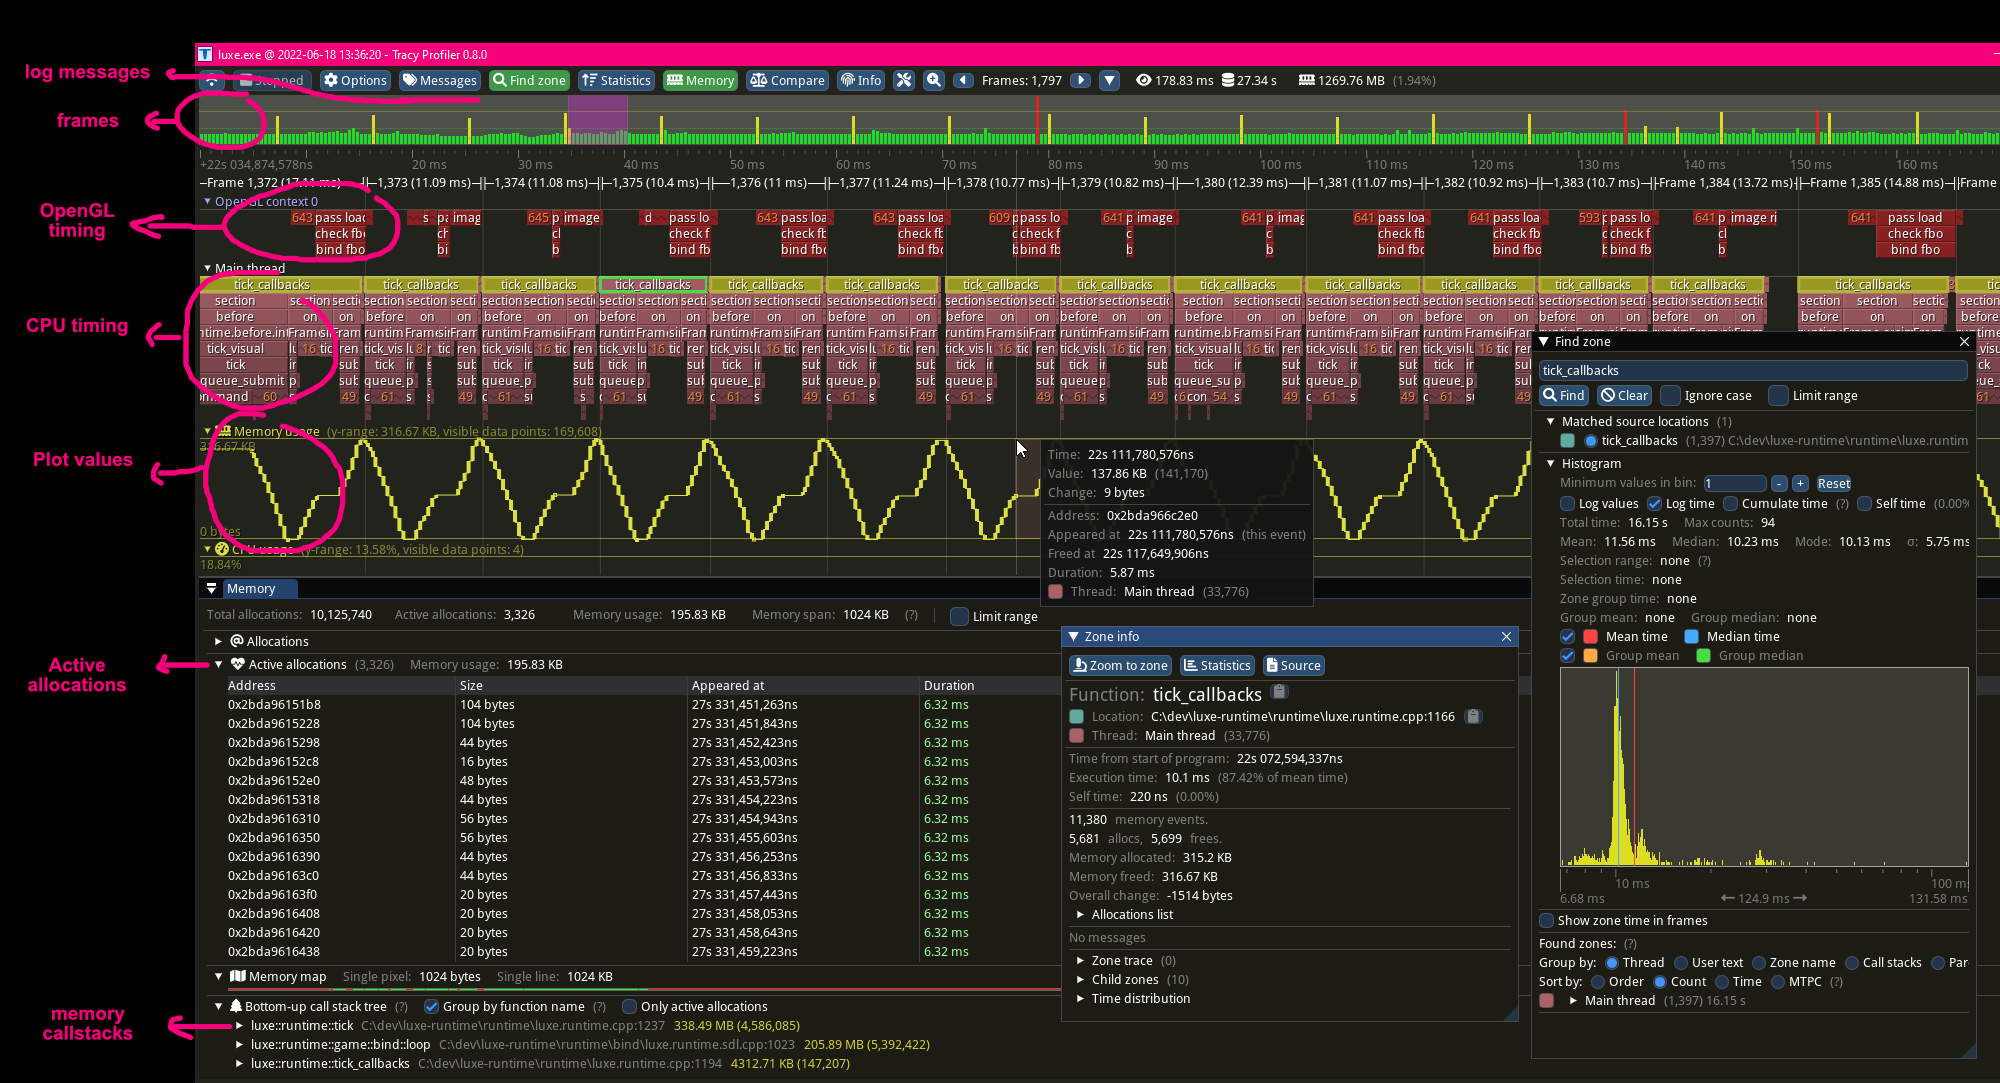
Run the game as Admin
If you run as admin Tracy can get more info, like information about all the threads in the system, and can display context switches for which code runs on which threads. It has a lot more info.
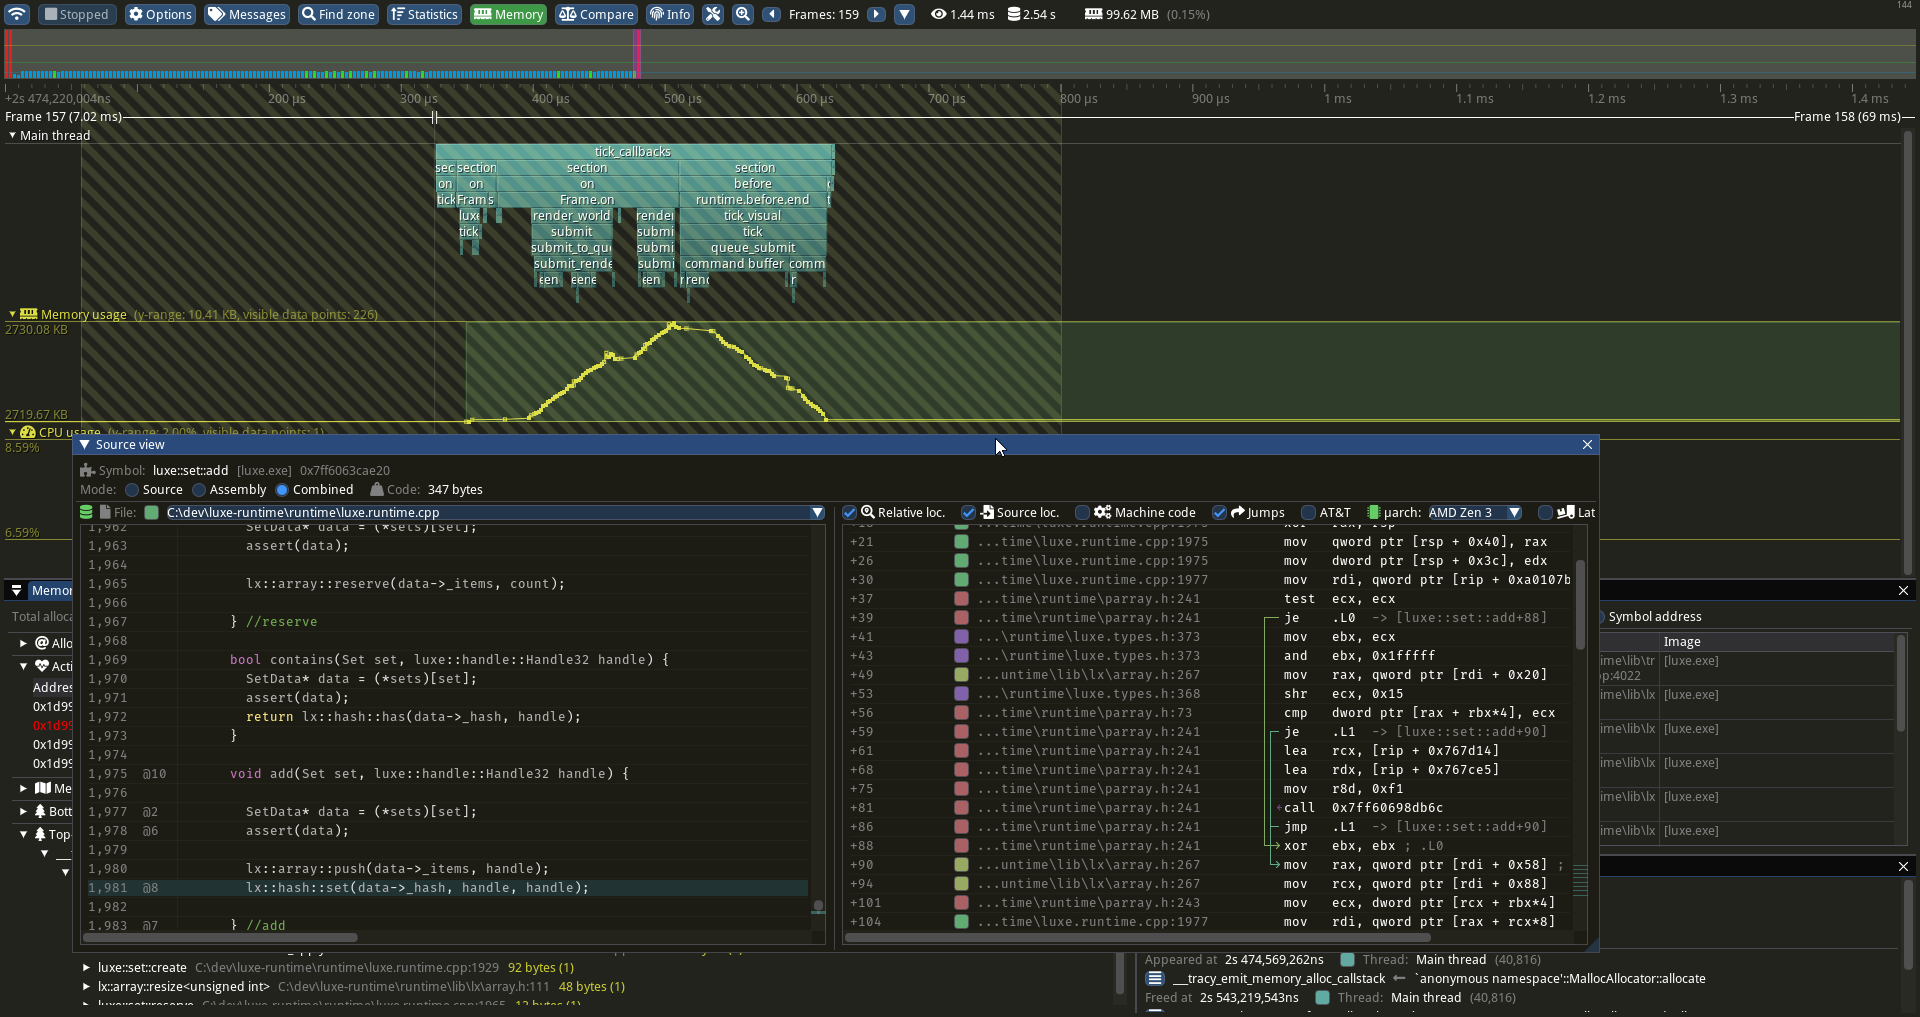
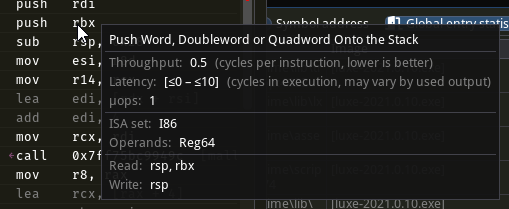
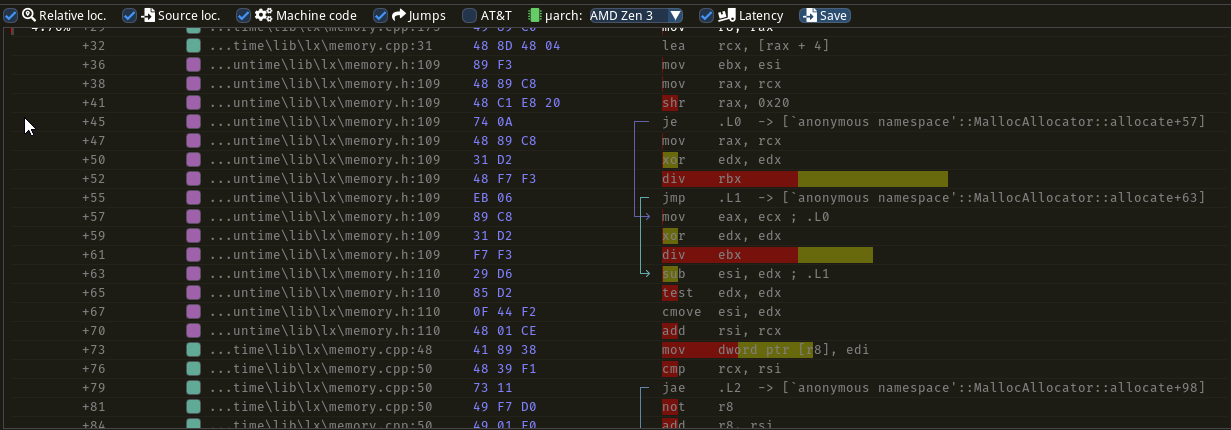
Assembly view
There's also disassembly views with instruction details and more. It's really really cool.
Have fun
Hope that helps! Tracy includes a detailed PDF documentation file, you should read it there's plenty of key stuff there. Make sure your versions match (e.g code matches the Tracy.exe application).
You can post comments in the community below.